| Figure Number |
Thumbnail |
Caption |
Credit |
| FIGURE 9.1 |  | Global SSTs are recorded every day from instruments onboard polar orbiting satellites. Often the imagery presented for analysis is a mean composite (a combination of other images collected over time) where data values are averaged and given false color. | photos.com |
| FIGURE 9.2 |  | Map of SSTs indicating SST in °C. | U.S. Satellite Laboratory |
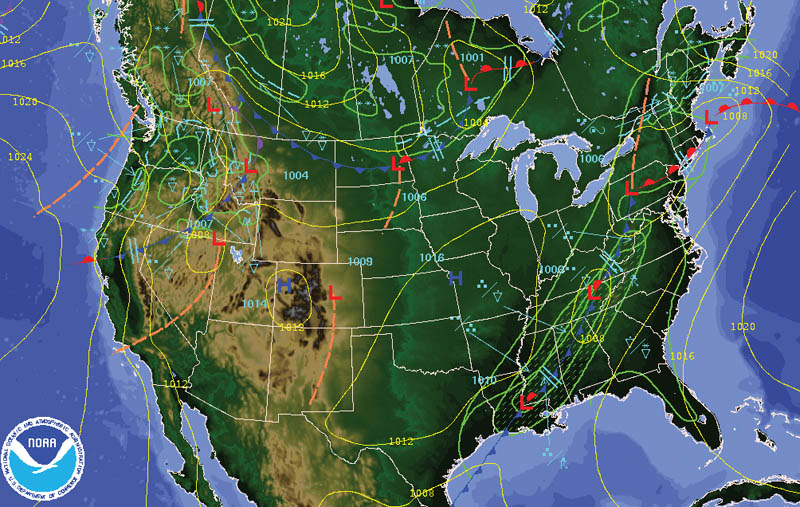
| FIGURE 9.3 |  | Isobars are lines of equal pressure. A barometer placed at any location on the line shows the same pressure reading on a barometer. | NOAA |
| FIGURE 9.4 |  | A false color satellite image gives meaning to scientific data. | NASA, GSFC |
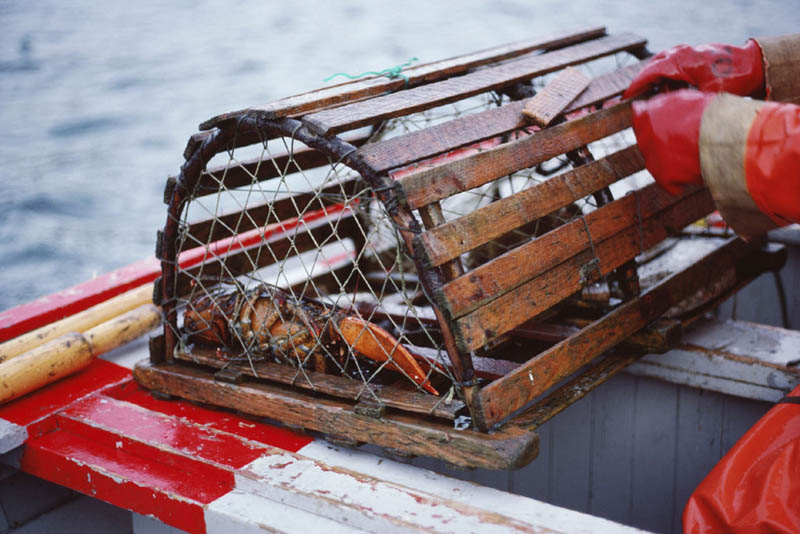
| FIGURE 9.5 |  | In addition to collecting scientific data, buoys are used to indicate the presence of fishing gear on the seafloor. This lobster pot is one such example. The trap sits on the bottom, with a line connecting it to a buoy at the surface. The buoy helps fishers easily find their traps to check for lobsters. | photos.com |
| FIGURE 9.6 | 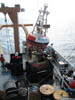 | NOAA scientists deploy a buoy from a research vessel. | NOAA |
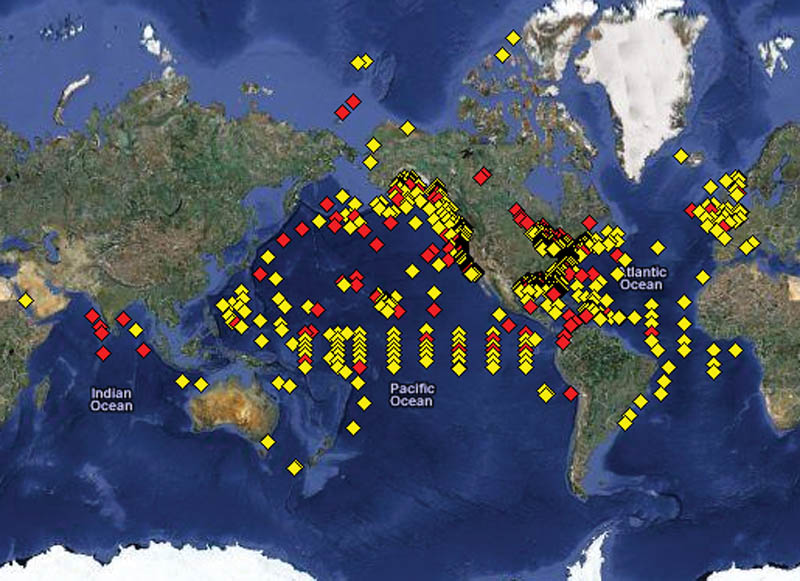
| FIGURE 9.7 |  | Scientific buoys are found around the world. Yellow points are recently updated. Red points represent data >8 hours old. | NOAA |
| FIGURE 9.8 |  | Lab materials. | photos.com |
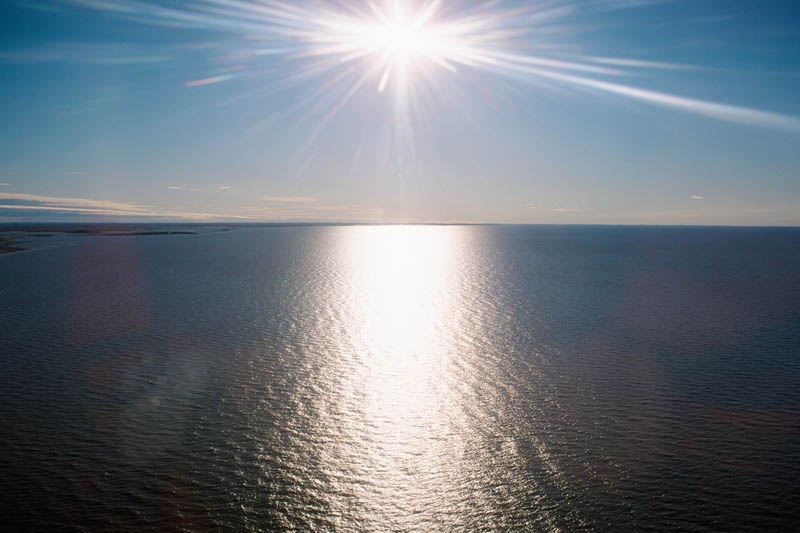
| FIGURE 9.10 |  | Sun shining over the ocean affects SSTs as energy is reflected and absorbed. The ocean is a feature on Earth distributing heat energy throughout the planet. | photos.com |
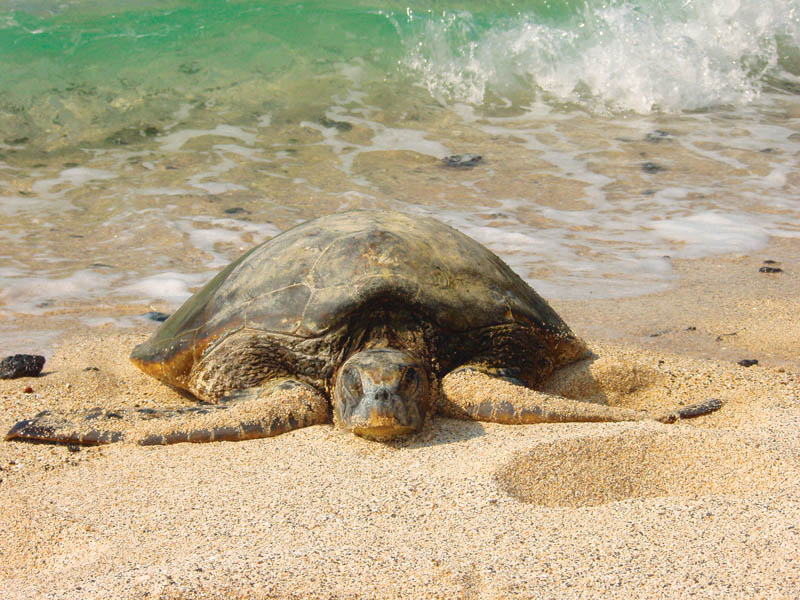
| FIGURE 9.11 |  | A Hawaiian Green Sea Turtle soaks up energy from the Sun. Most of the Sun's energy entering Earth's atmosphere is absorbed by the ocean. | NOAA/Claire Fackler |
| FIGURE 9.12 | 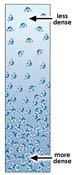 | More dense fluids sink until they reach a layer of the same density. | U.S. Satellite Laboratory |
| FIGURE 9.13 |  | Portrayed SST image without currents doesn't take into account Earth's rotation, tilt, and effect from the Sun. | U.S. Satellite Laboratory |
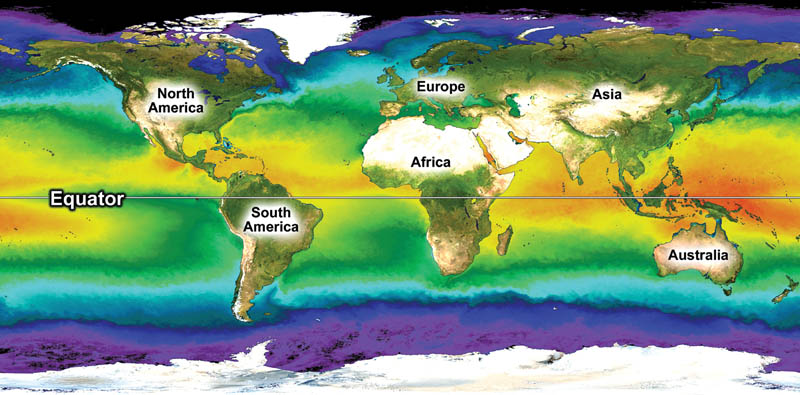
| FIGURE 9.14 |  | False color SST image derived from satellites provides scientists with data to analyze. Color representations demonstrate colder waters near Earth's poles. | NASA, GSFC |
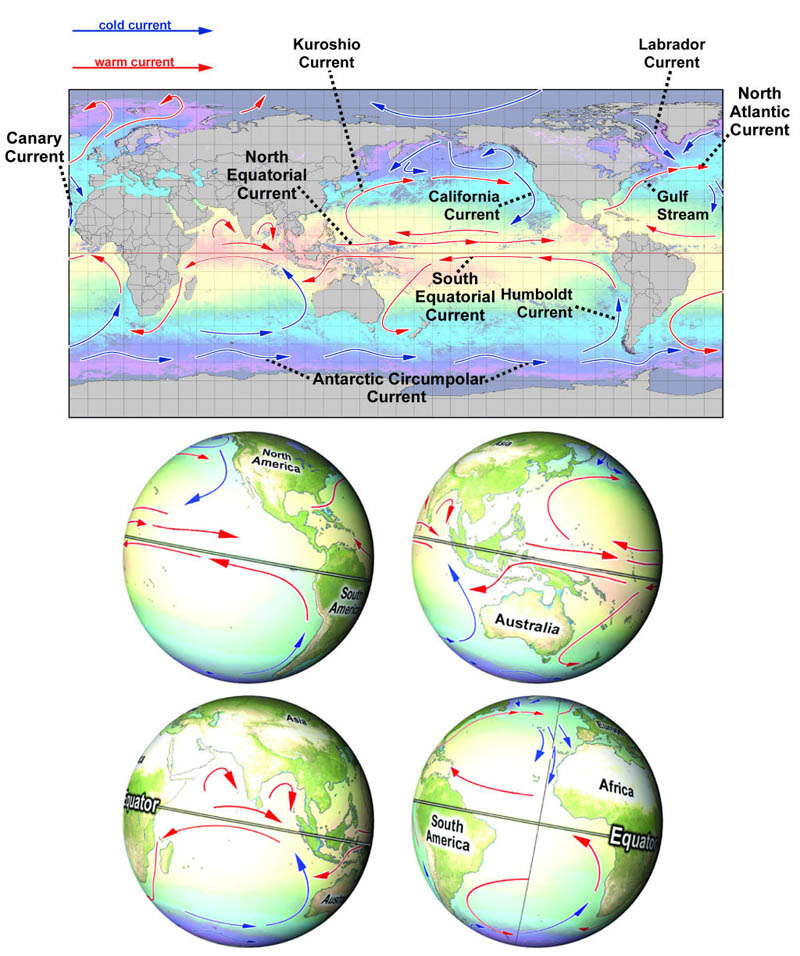
| FIGURE 9.15 |  | Selected major ocean currents illustrate the transport of surface waters. | U.S. Satellite Laboratory |
| FIGURE 9.16 |  | Monthly average SST image represents a composite of images. The mean SST maps are derived from dozens of images collected during the month. They are often used to compare temperatures from month to month, and year to year. | NASA, GSFC |
| FIGURE 9.17 |  | Earth's prevailing winds. | U.S. Satellite Laboratory |
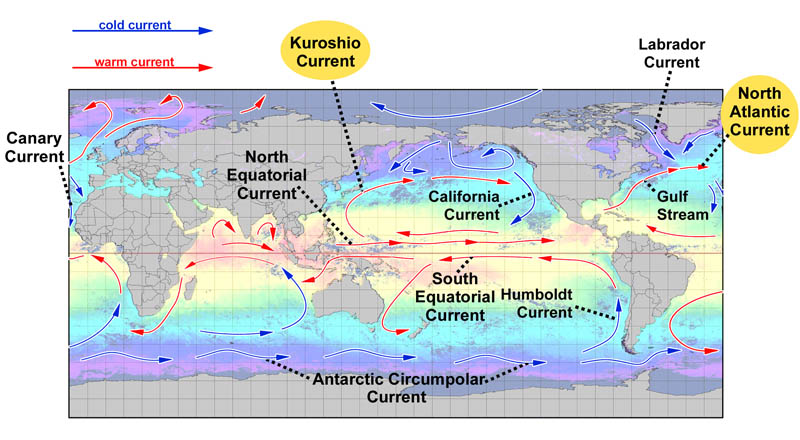
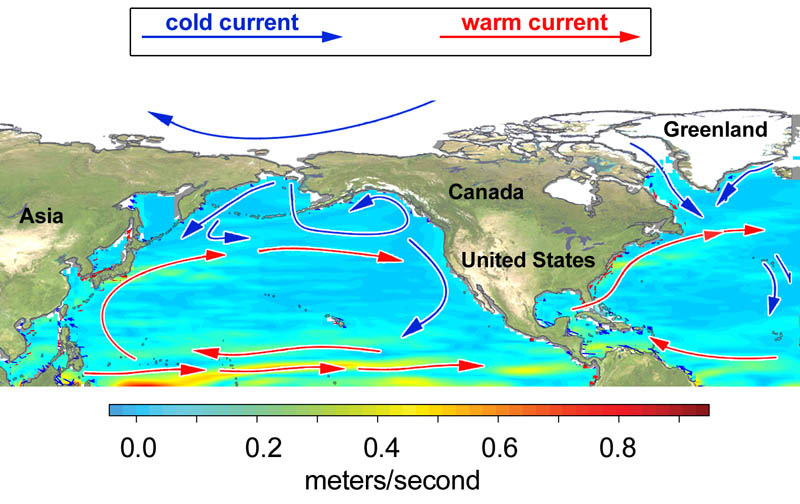
| FIGURE 9.18 |  | Selected ocean currents distribute heat across the globe in all directions. | U.S. Satellite Laboratory |
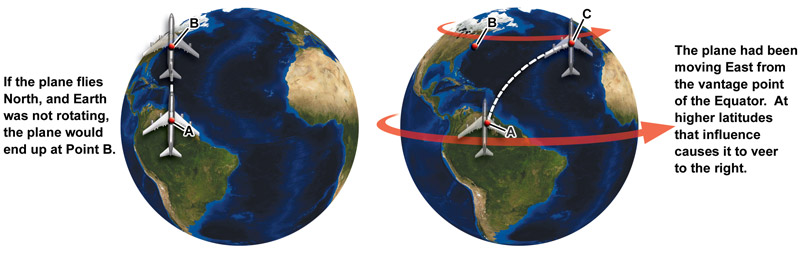
| FIGURE 9.19 |  | Airplane flies in a straight line over both a non-rotating and rotating Earth. | U.S. Satellite Laboratory |
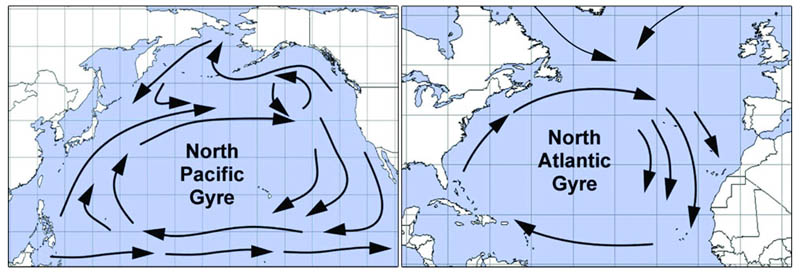
| FIGURE 9.22 |  | Loops of currents in ocean basins result in a circular flow of water called a gyre. | U.S. Satellite Laboratory |
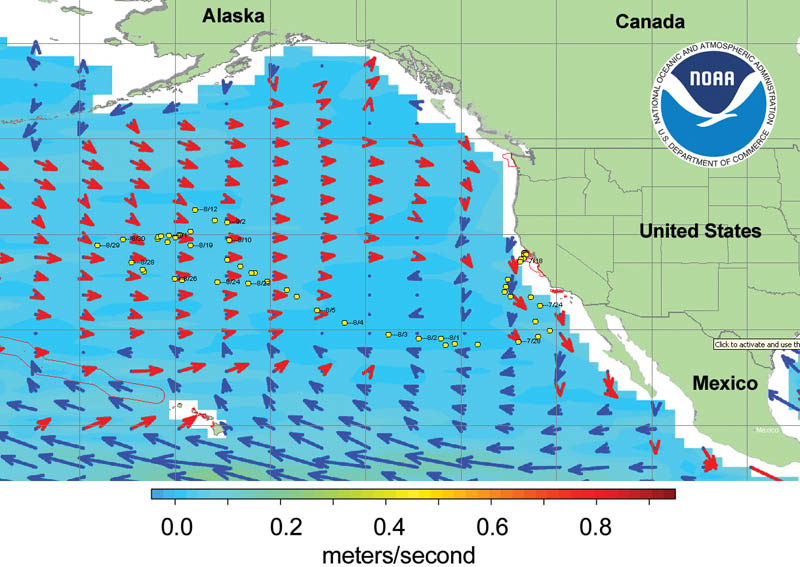
| FIGURE 9.23 |  | Ocean surface current image shows eastward (red) and westward (blue) surface water movement. | NOAA, Ocean Surface Current Analyses - Real time (OSCAR) Project Office, Earth and Space Research |
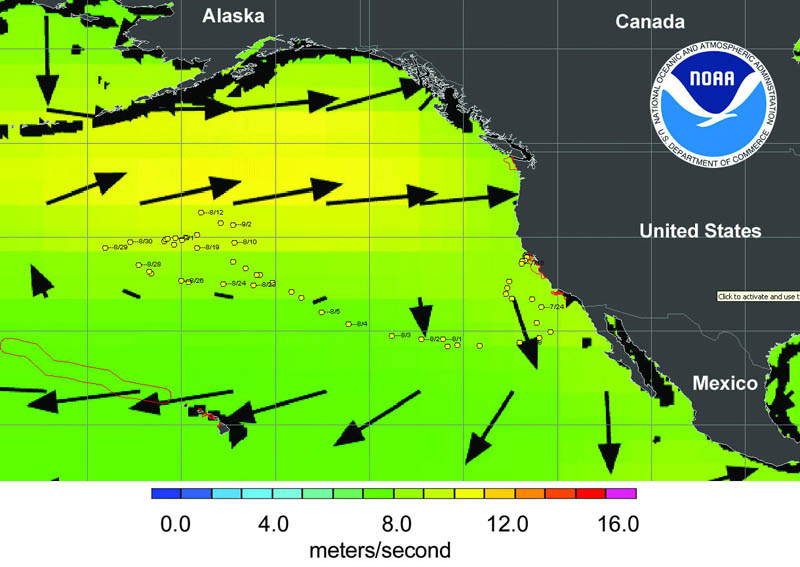
| FIGURE 9.24 |  | Wind speed and directions illustrate air movement over the ocean. | NOAA |
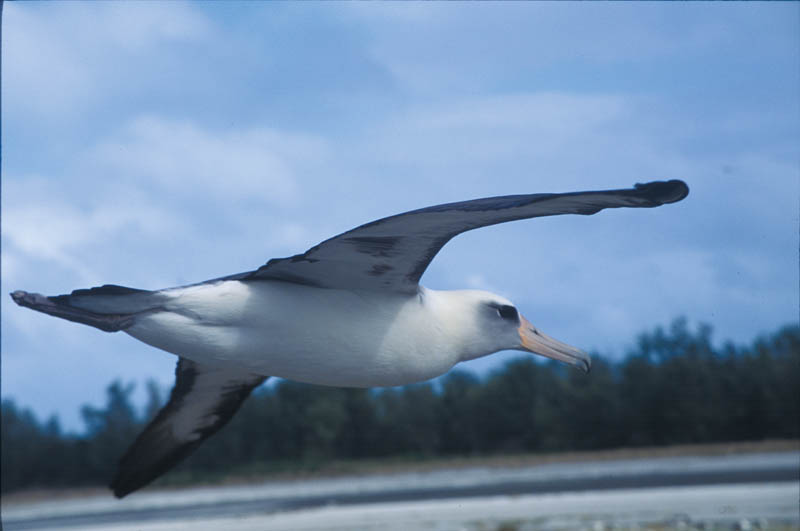
| FIGURE 9.25 |  | Seabirds such as the Laysan Albatross rely on wind currents for soaring many miles over the sea. | U.S. Fish and Wildlife Service |
| FIGURE 9.26 |  | Surface current illustration shows direction and indicates speed. It portrays currents as cold or warm. | NOAA, OSCAR Project Office, Earth and Space Research |
| FIGURE 9.27 | 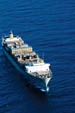 | Cargo ships travel on the ocean and can sometimes experience accidents in which cargo is lost. | photos.com |
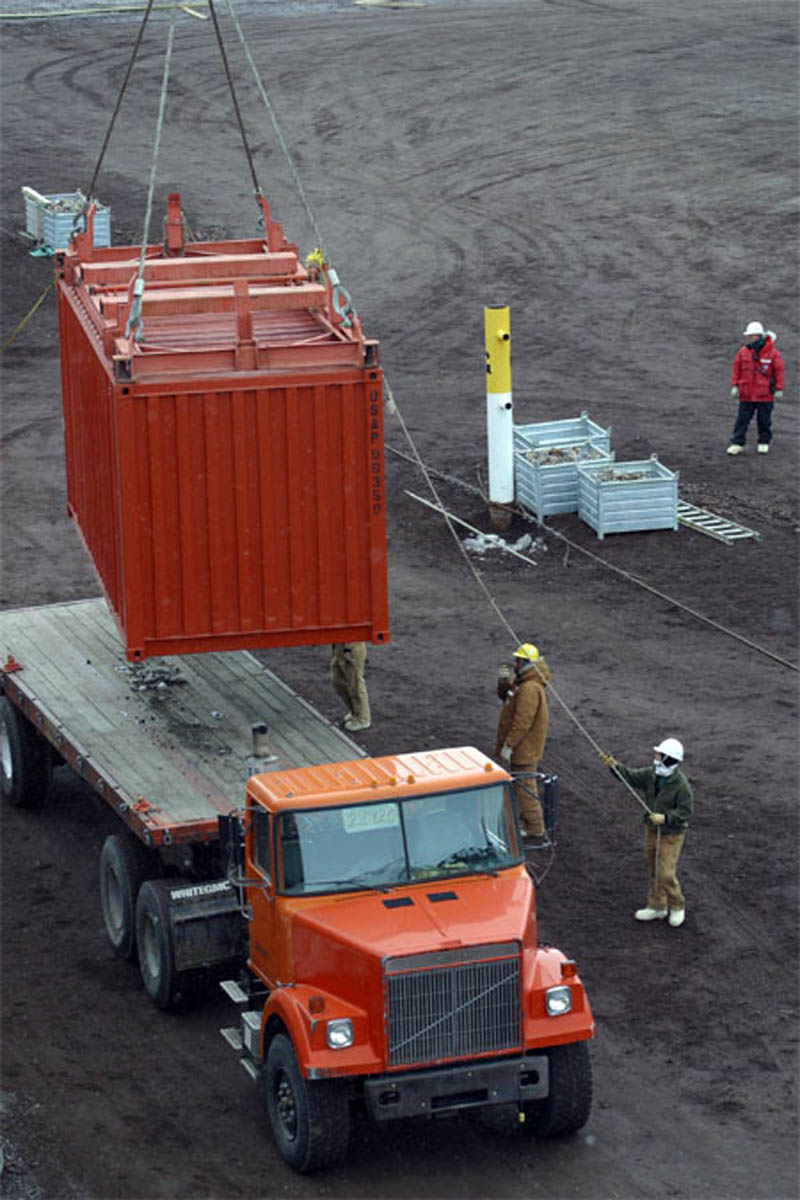
| FIGURE 9.28 | 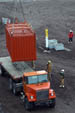 | Cargo Ships are used to transport goods all over the world. This photograph shows cargo containers being transferred to a truck in Antarctica. | National Science Foundation/Peter Rejcek |
| FIGURE 9.29 |  | Toys spilled into the Pacific Ocean and later traveled to some faraway places. | U.S. Satellite Laboratory |
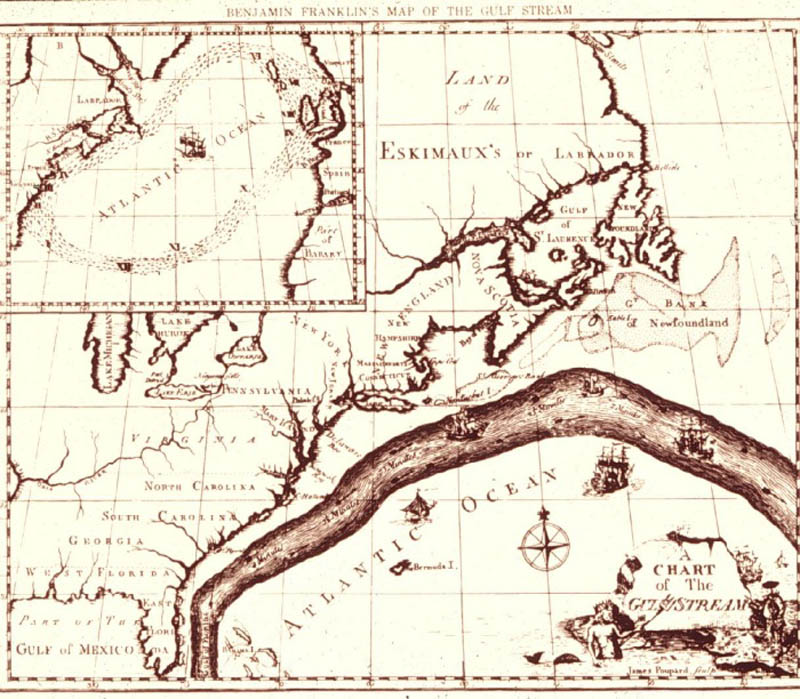
| FIGURE 9.30 |  | The Gulf Stream, as drawn by Benjamin Franklin (circa 1785). | NOAA |
| FIGURE 9.31 |  | Satellites and other marine technologies allow scientists to learn more about currents such as the Gulf Stream. This image shows ocean current velocities. | NOAA, OSCAR Project Office, Earth and Space Research |
| FIGURE 9.32 |  | The ocean stores a tremendous amount of energy, carrying it from the Equatorial to the Polar Regions. | photos.com |
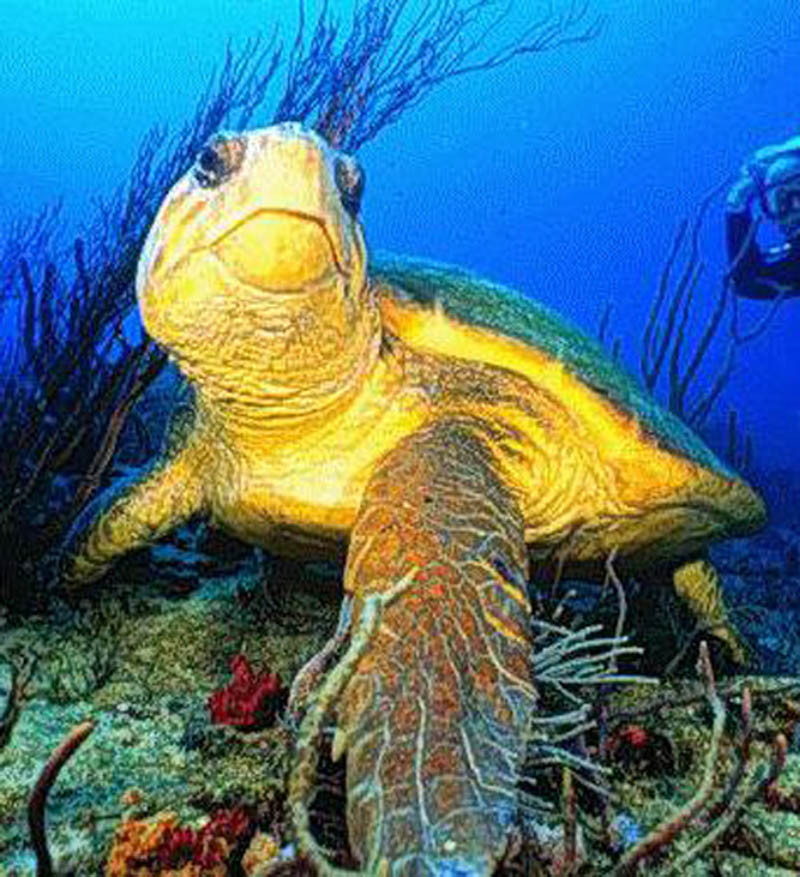
| FIGURE 9.34 |  | Loggerhead Sea Turtles are one sea turtle species common in United States waters. Their diet consists primarily of invertebrate animals, including sponges and crabs. | NOAA |
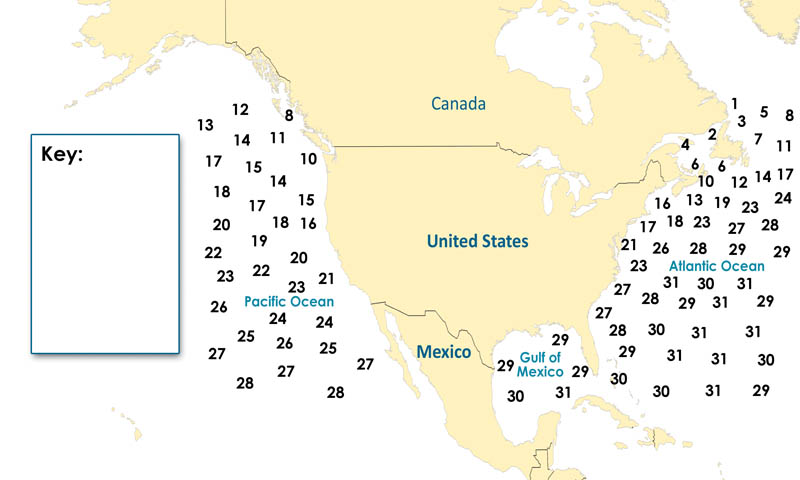
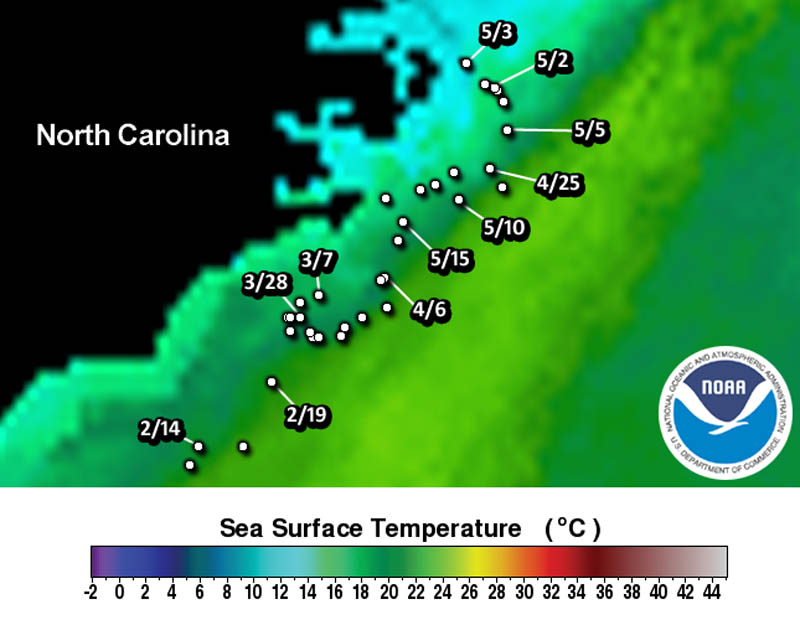
| FIGURE 9.35 |  | Jazz, the Loggerhead Sea Turtle, locations on a given SST map. | MOTE Marine Laboratory |
| FIGURE 9.36 |  | Studying the movements of sea turtles has taught scientists a lot about the behavior of these reptiles. | photos.com |
| FIGURE 9.37 |  | SST monthly mean image of the South Atlantic Ocean. | NASA, GSFC |